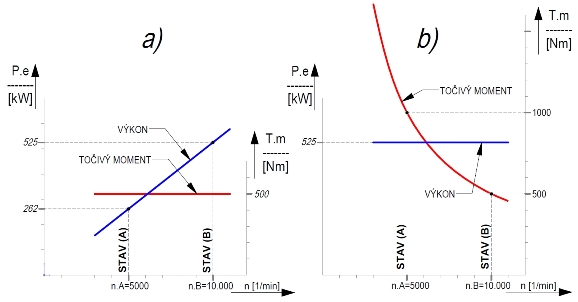
In our first entry into the traction theory we had explained the position of ideal operation point of an engine so that we can achieve the torque peak on the driven wheels Tk[Nm] and, by implication, the driving power peak F[N] as well, and the conclusions drawn led to the necessity to operate the engine in the area of output peak Pe[kW] disregarding the amount and position of the engine torque Tm[Nm]. Let’s give two more typical cases here when engine a) has a constant torque Tm=const (for example, 500 Nm) and engine b) has constant output Pe=const (for example, 525 kW). The engine output a) with a speed in terms of Pe=(π/30)*Tm*nm=const*nm will increase linearly (this is typical for atmospheric engines) while, on the contrary, the torque of engine b) in terms of Tm=(30/π)*(Pe/nm)=const*(1/nm) will hyperbolically decrease (this is typical for supercharged engines limited with restrictor), Fig.4:

Fig. 4
[TOČIVÝ MOMENT-TORQUE; VÝKON=OUTPUT; STAV=CONDITION; /min=rpm]
We use equation (7) from the opening article of our miniserial for enumerating the amounts of torque on the driven wheels, for a constant velocity again (we remind that for w=const a condition (nA/nB)=(iA/iB) must be met; if we select iA=10 then iB=20):
Case a):
TkA=Tm*iA=(30/π)*PeA*(iA/nm)=500*10=(30/π)*262exp+03*(10/5000)=5000Nm, TkB=Tm*iB=(30/π)*PeB*(iB/nm)=500*20=(30/π)*525exp+03*(20/10000)=10.000Nm.
Case b):
TkA=TmA*iA=(30/π)*Pe*(iA/nm)=1000*10=(30/π)*525exp+03*(10/5000)=10.000Nm, TkB=TmB*iB=(30/π)*Pe*(iB/nm)=500*20=(30/π)*525exp+03*(20/10000)=10.000Nm.
While in case a) we have to secure that engine is operated as close to operation point (B) as possible to attain the torque peak on wheels (for example, by connecting the engine with the driven wheels via variator), it does not matter at all in case b) in which area we operate the engine since within a range from five to ten thousand revolutions we will attain the identical torque on wheels of 10 kNm at each moment. This means, among others, that if we connect a gearbox to engine according to b), the gearbox would have to be designed in such a way that a gear change from lower to higher speed gear causes engine speed to drop by just 5000 rpm since any deeper drop in speed during gear change would have absolutely no significance for the final torque on wheels (because we also have a constant torque on wheels within a constant output speed range, se relationships for TkA, TkB for case b), and gear shifting thence brings no advantage – or quite the other way – it inflicts losses in traction). On the other hand, it is necessary for case a) that engine speed drops as least as possible during gear change so that we can operate the engine as closest to its output peak as possible.
However, different view of the graphs from Fig. 4 shows us that even if an engine has a constant (flat) torque according to a), application of the engine in a racing car cannot get along without multi-speed gearbox (or variator). On the other hand, compare the engine with dramatically decreasing torque according to b) that is seemingly “ready to be scrapped” due to the torque curve behaviour but that is surprisingly far more employable for racing mainly due to the futility of frequent gear shifting.
We employed a very simple deduction to get to another rather detrimental myth of motorsport when the engine characteristic is asserted (and required) with a flat torque that is, as we had proved, absolutely unfit for the attainment of maximum torque on wheels. On the other hand, a flat performance curve according to b) brings far wider range of maximum torque on wheels and it nevertheless does not matter at all that engine torque decreases.
Remark 5: Here we have an answer to the matter of comparing the WRC category cars (typical case of the characteristic according to b)) and, for example, S2000 (characteristic according to a)) in terms of drive output (in conformity with definition from Remark 1 of the opening article of our miniseries). It is matter of course that the WRC spec. cars will provide far wider range of constant torque on wheels (it is almost 2300 rpm) and despite the similarity of peak outputs, the WRC spec. car will attain much higher drive output in total in the area of efficient speed spectrum.
Remark 6: Let’s take another look at the graphs from Fig. 4 in terms of energy to explore the torque curve. At the first glance we can see that the surface under curve Tm is substantially larger for case b) and it would have been seemingly possible to make instantaneous decision on far better fitness of engine b) without considering the previous explanation (particularly so when the torque of engine b) is much higher in all aspects of the characteristic than in engine a)). And truly – if we realize that the unit of engine torque - Nm(Newton metre) has a physical size kg.m2/s2(kilogram metre square per second square) which is at the same time a size of energy it is obvious that much greater input energy must have been introduced (in a fuel) into engine b) than into engine a). As a matter of fact, the engine torque is directly dependent on a mean effective pressure acting on piston pe[MPa] and this pressure is directly dependent on the amount and calorific value Hu[kJ] of fuel (mixture) again. However, let’s imagine now that variator is connected to engine a) and this variator will be used to keep the engine in any driving mode at a specific speed nB(=10.000 rpm) and that we will obtain a permanent torque peak on the driven wheels. All of a sudden, the difference between engines a) and b) completely fades out in our eyes (the cars will attain identical drive outputs) and we, through engine a) (connected with the variator), attained completely equal effect as in case b) with much lower energy intensity and the high values of torque Tm are without avail for engine b).
Let’s now take a look at particular case of F1 vehicle’s gearbox design for an engine with characteristic according to Fig.5:

Fig. 5
[/min=rpm]
Because what is in question is atmospheric engine with practically ever growing output, it is prerequisite to use multi-speed gearbox which will allow a minimum speed drop after gear change and, in doing so, the engine operation as close to the engine output peak as possible. We usually admit an output loss under gear change in highly tuned engines of about 5%Pmax (in out case it is about 30 kW). Firstly, maximum velocities to the first and last gear must be determined; we will be concerned with a seven-speed gearbox design, selecting the maximum velocities to the first gear and the seventh gear to be 130 and 320 km/hr respectively at the engine speed of 19000 rpm. It is customary in technical practice to elaborate so called traction-speed diagram (hereinafter RD, a resemblance with word caps of unnamed team chief is merely coincidental) where X-axis depicts the vehicle velocity while Y-axis depicts engine speed. In out case, RD may look like, e.g., on Fig.6:

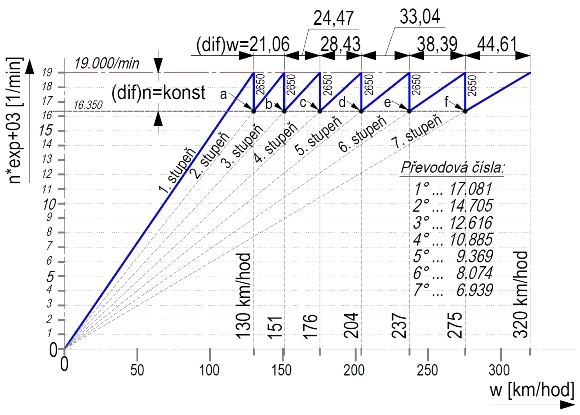
Fig. 6
[(dif)w=konst = (dif)w=const; km/hod=km/hr; 1.,2.,3.,4.,5.,6.,7. stupeň=1st,2nd,3rd,4th,5th,6th,7th gear; Převodová čísla=Transference numbers; /min=rpm]
It is created according to the relationship for car velocity w[km/hr] in dependence on the engine speed nm[1 rpm], the transference number ic and the dynamic radius of driven wheels rk[m]:
w = ωk * rk * 3.6 = (π/30) * 3.6 * (nm / ic) * rk [km/hr; 1 rpm, m] (8)
Quite a number of data can be read from the speed diagram on Fig.6 as, for example, velocities for maximum engine speed and individual speed gears, speed drops under gear change, character of the differences of max. velocities for individual speed gears, and much other information. For instance, Fig.6 shows that F1 vehicle can move at a velocity of 180 km/hr (in RD, position marked “X”) to 3° at engine speed of 17.690 rpm, or to 4° at a speed of 15.200 rpm, or to 5° at a speed of 13.325 rpm, and so on.
The RD on Fig.6 is created using so called “classical attitude” that is typical of constant increment in maximum velocities (dif)w [km/hr] (in our case, it is (dif)w21=162-130=32km/hr, (dif)w32=193-162=31km/hr, (dif)w43=225-193=32km/hr, etc.). In this case, the intersections of vertical lines and speed function lines (on Fig.6 they are marked as points a, b, …, f) are located on exponential curve so that speed drop decreases with each gear change to higher speed gear, as you can see in RD ((dif)nm12=3722 rpm, (dif)nm23=3112, etc.). However, if we compare these circumstances with our deductions on the necessity to operate an engine as close to its output peak point as possible, we can feel that this classical attitude to gear designing is incorrect. For an engine to be operated in such a way to approach its output peak as close as possible, it is necessary that, on the contrary, the speed drop is constant under each gear change allowing us to be within the area marked (dif)n in the graph according to Fig.5 where we can really utilize the engine’s peak output the best possible way, respecting the output loss under gear change up to 5%Pmax.
Let’s see what happens to RD if we observe the rule on a constant speed drop after gear change, Fig.7:

Fig. 7
[(dif)n=konst = (dif)n=const; km/hod=km/hr; 1.,2.,3.,4.,5.,6.,7. stupeň=1st,2nd,3rd,4th,5th,6th,7th gear; Převodová čísla=Transference numbers; /min=rpm]
For this modern attitude to the distribution of gears, characterized by the location of points a, b, …, f on a horizontal line it is, however, necessary to change down in very short time intervals while changing, for instance, from the sixth gear to the seventh gear will take relatively long time. It is given quite naturally by the change in differences of maximum velocities (dif)w21, (dif)w32, … see Fig.7, and while the driver could shift gears more or less rhythmically (in almost constant time interval) in the classical approach (Fig.6), the driver must pay much more particular attention to gear shifting in the modern approach to traction (Fig.7) and the drive with gears designed this way is more demanding.
The modern approach to traction according to Fig.7 can be neatly observed in top-teams, and it was McLaren that took the most radical stand to it, to be followed by Ferrari and Williams, on the contrary, the teams from the lower field’s half have not yet fully understood the traction theory, applying the classical attitude according to Fig.6.
However, what remains now explains one more phenomenon typical of F1 vehicles – how to deal with the surplus of torque on the driven wheels in the lower speed gears. Given the limited adhesion, the driven wheels are in no way capable of transmitting the theoretical peak here so that the engine operation condition in the engine output peak point thence does not need to be adhered to and we will admit deeper speed drop under gear change for lower speed gears in order to enter the operation mode (after gear change) of the engine with lower output (and, by implication, with lower torque on the driven wheels as well). We remind again that even if we get into the area of higher engine torque as a result of deeper speed drop (see Fig.5) the transference number will (given the higher speed drop) thus be reduced so much that the total product (Tm*ic) will be lower, exactly in accordance with our previous conclusions on the engine’s operation points.
Remark 7: When in the first gear the F1 engine will generate a maximum torque on the driven wheels of 5460 Nm (we can imagine the torque as the action of weight of a mass exceeding 0.5 ton at 1 metre long lever, and this is pretty much indeed) which cannot be transmitted by tyres in any case; even if thrust is practically absent in this case due to a low velocity.
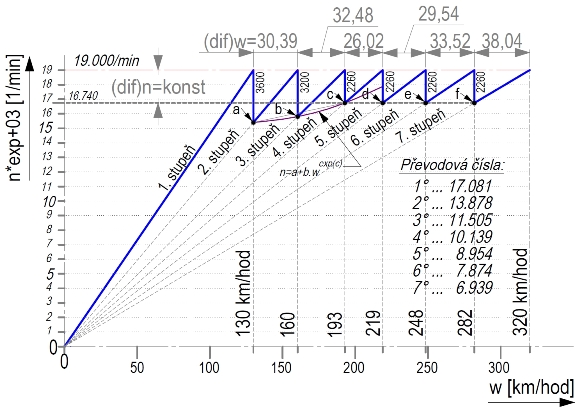
The RD accepting the adhesion consequences may look like that on Fig.8:

Fig. 8
[(dif)n=konst = (dif)n=const; km/hod=km/hr; 1.,2.,3.,4.,5.,6.,7. stupeň=1st,2nd,3rd,4th,5th,6th,7th gear; Převodová čísla=Transference numbers; /min=rpm]
The impact of aerodynamic thrust force which increases adhesion is expressed by exponential curve (points a, b, c). Our graph presumes that when in the third speed gear the vehicle is already fully capable of transmitting the torque to the roadway. Please take a note that by using the transference numbers conceived this way for the second and third gears we succeeded in narrowing the speed drop range under the change to the fourth and other gears (up to 2260 rpm) even more which brings us even closer to the output peak point by operating the engine (we exploit better the part of performance curve with higher output where we lose even lesser than 5%Pmax after gear change, see Fig.5).
Another option how to deal with a surplus output and surplus torque on wheels in the lower speed gears is to re-map the engine simultaneously with gear changes in such a way that the pilot is minimally employed with slippage control in the low-velocity modes.
Lastly it is important to mention the need to regulate transference numbers according to courses as well. This pertains predominantly to the maximum velocities for the first and seventh gear, however, it must be pointed out that further adjustments of gearings according to, e.g., the character of road bends, is made minimally today. It is caused by the fact a gearbox – as we mentioned above – is “tailor-made” for an engine mainly, and the necessity to fine-tune the gearbox to fit the course was a phenomenon of the past when use was made of gearboxes with a low number of speeds that were not capable of satisfactory covering the needs of engine and racer. Despite all of this, it still holds true that the least nuance in the tuning the engine and gears may bring valuable tenths in the total drive output of a vehicle.


